Task and Resource Scheduling Database

Task and Resource Scheduling Database Built in Access

The University of Manchester’s Estates and Facilities Department is responsible for managing all drawings and data relating to sites and buildings owned by the university. This includes updating drawings and data for particular buildings, providing information or drawings for third parties, as well as participating in a number of other projects. At the time that they approached us tasks were managed and people’s time was tracked using several spreadsheets. The Department wanted to reduce the amount of effort used in keeping these records up to date, automate the processes involved and keep a record of the work being done going forwards in a more suitable tool. Hence the brief was to create a tool to allow them to maintain their Task List, schedule resourcing against it and match timesheet entries to both the Task List and Resource Schedule.

The Solution

Xlteq Access Consultants built a database designed to hold all task and resourcing information in order to replace the spreadsheets and keep a running record of all tasks. It was also designed to show resource allocations and to allow timesheet entry for each individual in the team.

The Process

Task Creation and Categories

The tasks in the spreadsheet were held on different tabs to show whether they were main tasks or sub-tasks, although not all main tasks had subtasks. There were also a number of columns on each sheet showing how each task was categorised and the corresponding file reference where the data or drawings would be stored.

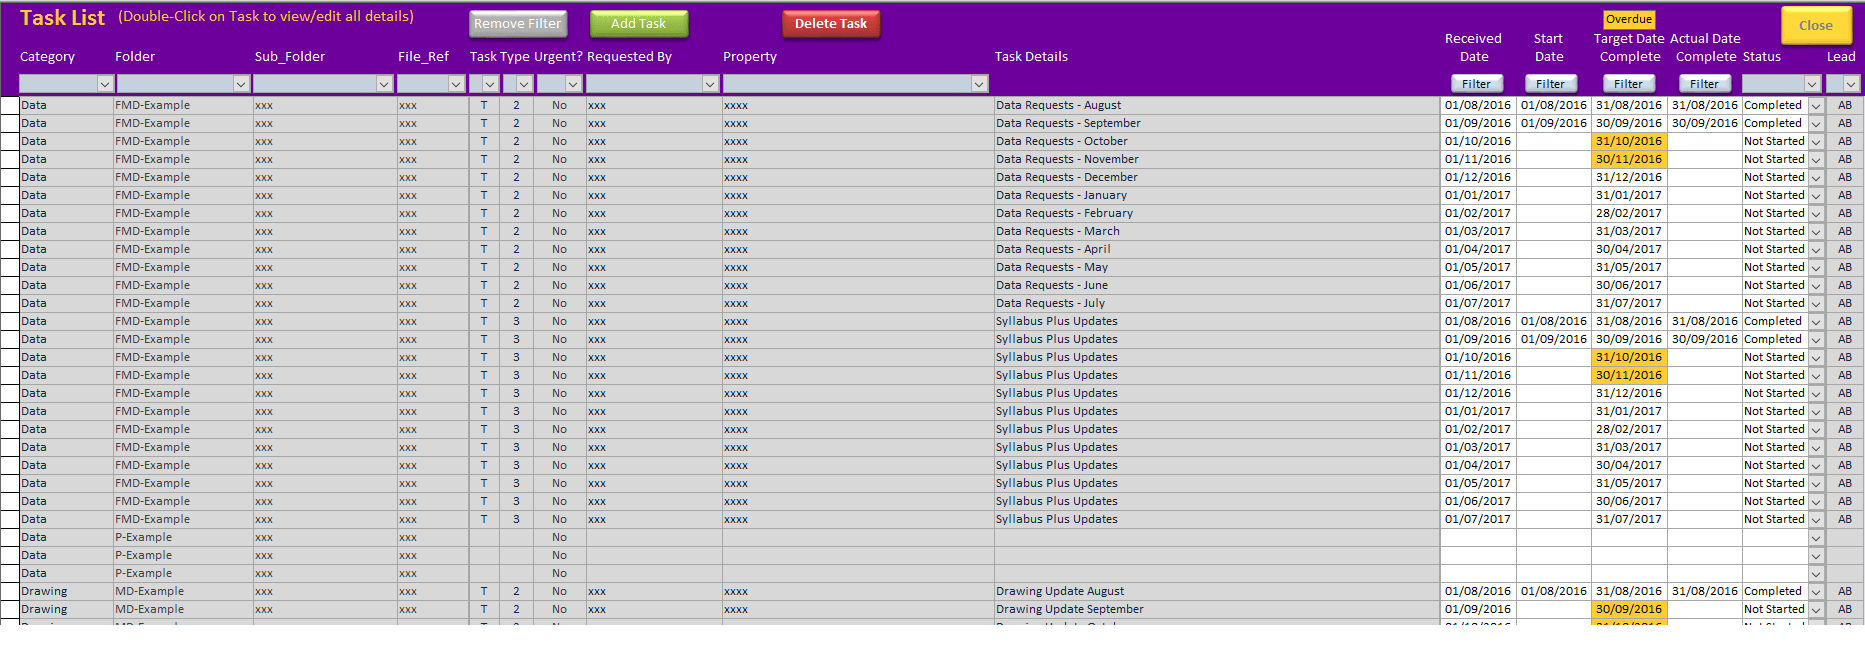
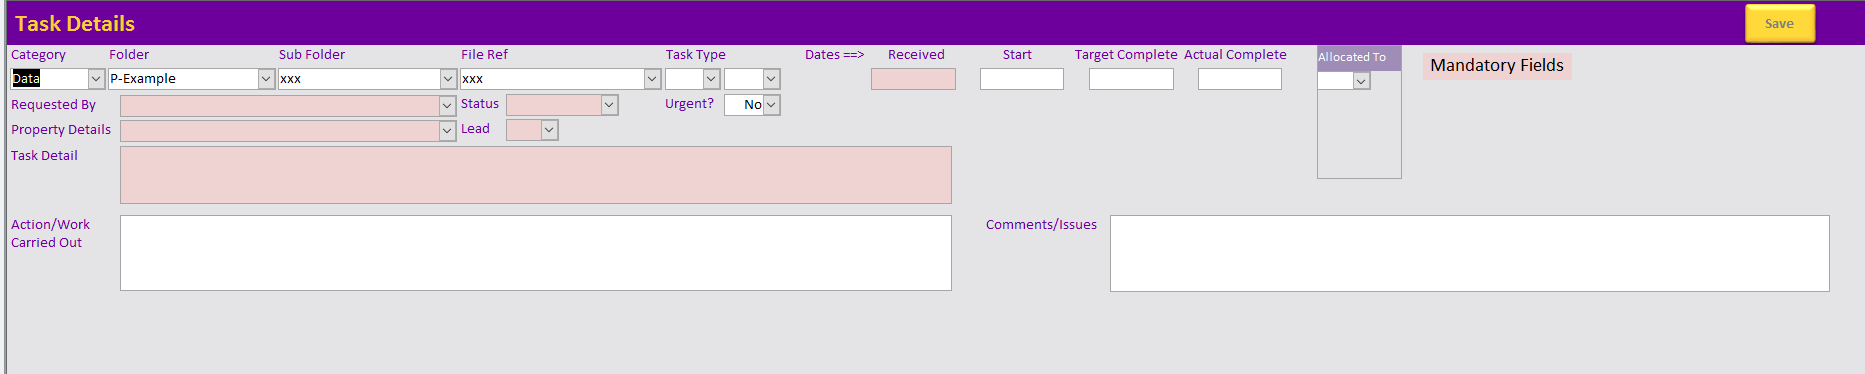
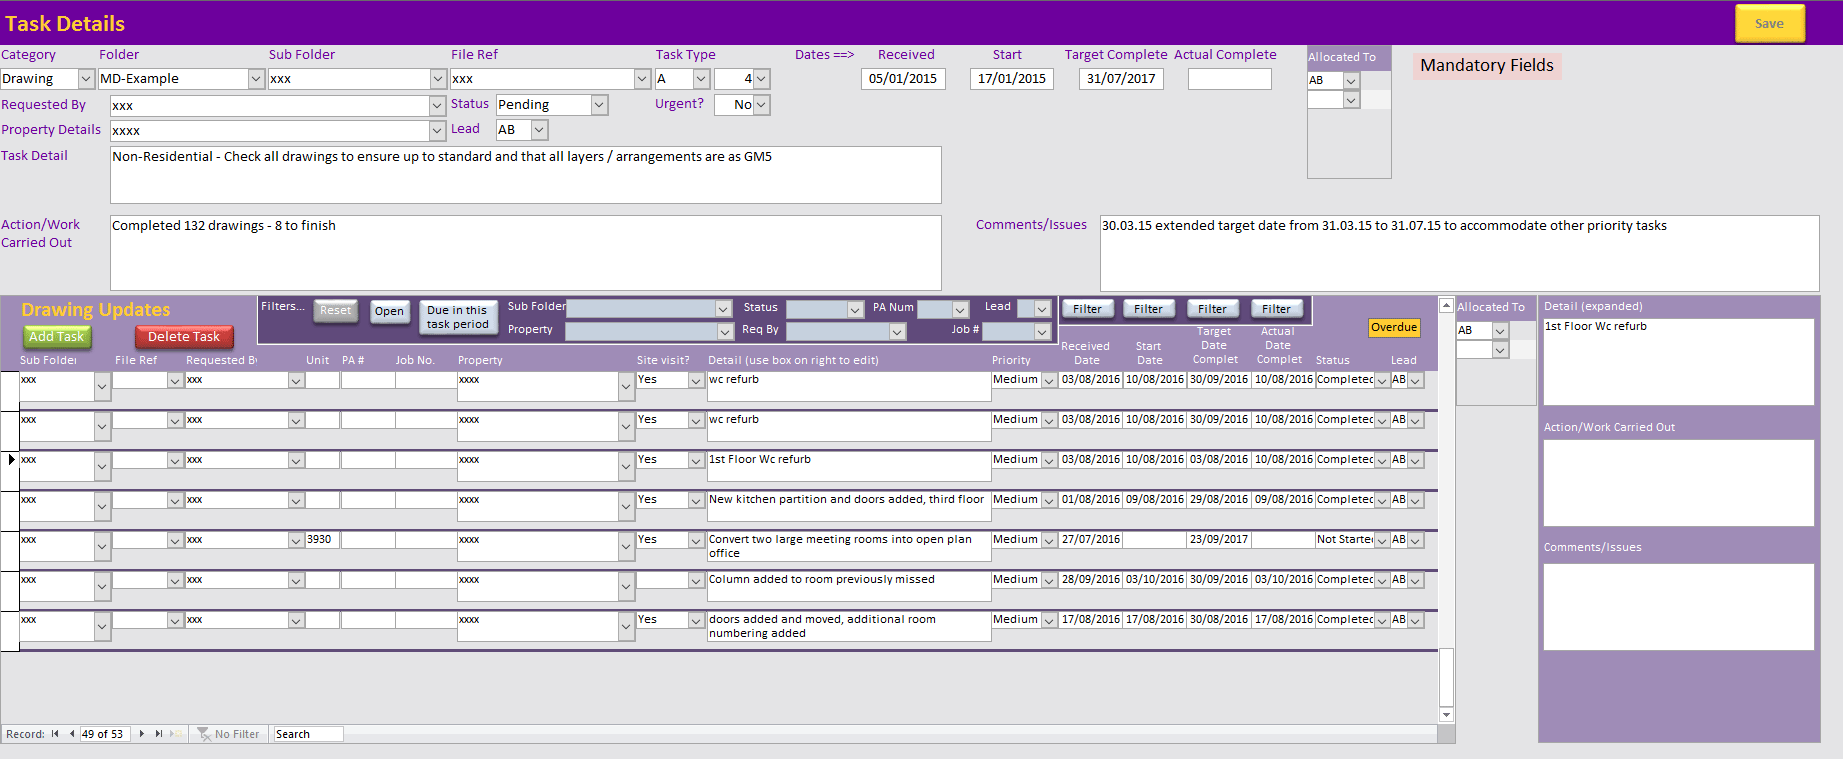
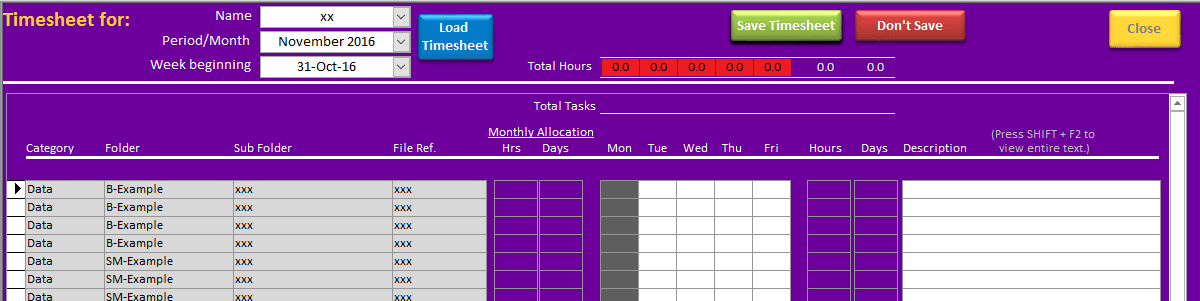
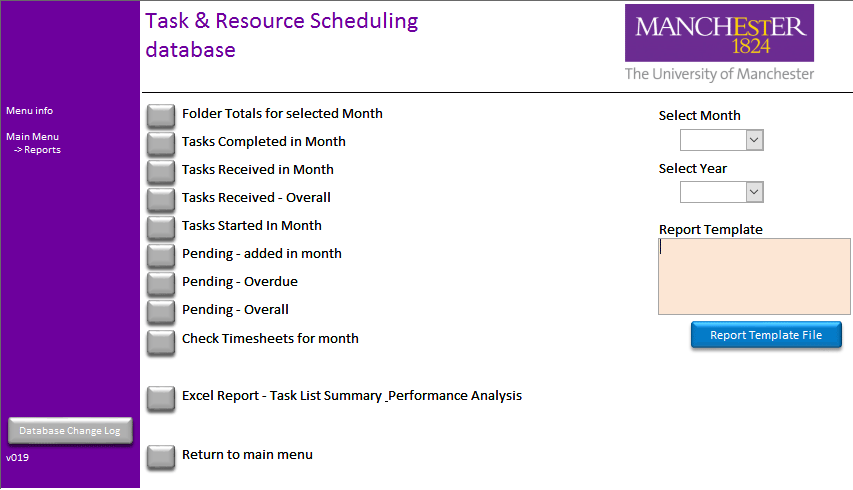
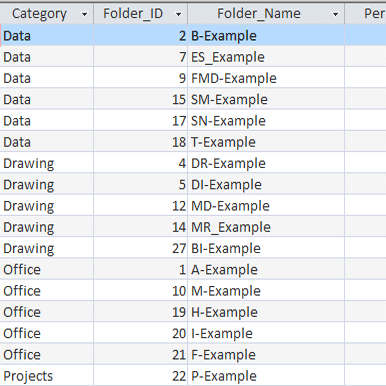
Once we began the process of transferring this information to a series of database tables, it became clear that a few changes to the way tasks were categorised would be needed and so a new category hierarchy was created by the client and added to the database. There was also the problem that each tab in the existing spreadsheet had many columns, which would not all display in a single Access form. The solution was to list the basic information associated with each task (Figure 1) and then provide a link to more detailed information on another form; the user only needed to double-click on a task to get to information such as the details of the work carried out and any notes from the person responsible. In this way, links could also be provided to any sub-tasks associated with the main task. In this way, all the relevant information was displayed without the user having to scroll backwards and forwards across the screen (Figures 2 and 3).


The numbers of tasks and subtasks could also have presented a problem (in that there were too many to be able to easily locate one particular record) so filter list boxes and buttons were added to the form to allow individual tasks to be found quickly and easily. (The date buttons opened another form that allowed particular dates to be selected.)

Figure 1: Demonstration View of the Main Task List

Once the tasks were in the database, issues such as data cleansing and data validation could be addressed. For example, the Estates and Facilities Department deals with a list of many buildings, grouped into different sites and areas. In many cases, the way that these buildings were referred to in the data was either inconsistent or incorrect due to misspellings and references using only part of the full name. In order to implement a drop-down menu from which sites and buildings could be selected, the data had to be cleaned so that the existing records all had buildings referred to by the names in the list.

Figure 2: Task Details Form

Each form and subform was given some validation to ensure that mandatory fields for each task and subtask were completed when a new task was created. (Such as “Requested By” so the request could be traced if there were queries, for example.)

Figure 3: Demonstration View of Drawing Updates Subtask Form

Resource Scheduling

The next step in managing the University of Manchester’s tasks was to allocate them to team members as appropriate, on a monthly basis. Creating a form to do this was relatively easy; however, the data behind the form had to be carefully managed so that time allocations were not saved automatically, but only when the user chose to do so. A series of temporary tables were used to create “dummy schedule” tables which could then be written to the actual data or discarded, depending on what was required.

When the user goes to schedule resources, they must first select a month for which they wish to create a schedule. If a schedule already exists, then it will be loaded (into the temporary table as well to hold changes before they are saved). However, if not then a new schedule will be created in the temporary table, based on the tasks due that month and the team members available.

Figure 4: Demonstration View of Resource Schedule

Once the scheduling is complete the information held in temporary tables is written to the main database. This allows for the option of “Don’t Save”, where the changes may be discarded.

Timesheet Entry

The same approach was taken to Timesheet Entry as for Scheduling Tasks; a temporary table was used as the data source for the form so that changes could be written back to the database or discarded, rather than being saved automatically.

Initially, the form appears showing; name, period and week must be selected before a timesheet will load. This allows existing entries to be loaded or new entries to be created. The timesheet load as a subform.

When a new timesheet loads, any days which do not count for that month will be greyed out as shown in Figure 5; these cannot be edited. This is either because the days are not within the month listed, as in this case, or because they are bank holidays. As well as entering time against tasks already listed, there was also a requirement for staff to add in ad hoc work which had not been part of the main task list. In order to do this, a second subform was created to handle these additional tasks with the same parameters and validation as the main timesheet form (e.g. Covers the same period, same days greyed out, etc).

Figure 5: Demonstration View of an Empty Timesheet

Reporting

Originally, a number of summary reports were compiled manually from the task and resourcing spreadsheets. The final step was to add in the means to generate these reports automatically from the database.

Figure 6: Reporting Options

Figure 6 shows the various report options as they appear within the database. The first 8 report buttons generate as Access Summary reports like the one in Figure 7; each of these requires the month and year to be selected but will allow summary reports to be easily compared from month to month. The “Excel Report” button creates a spreadsheet to be used for presentation to management to demonstrate progress over the month. 

Figure 7: Example of a generated Access Summary Report  

This is a direct replacement for one spreadsheet that had to be recreated manually every month. An example of the graphs within the template, which are updated when this report is run, is shown in Figure 8.

Figure 8: Example of one of a presentation graph from the Excel Report Template

Contact us for a free consultation

Either call us now on 020 3817 6945 or fill out the form below and one of our team will be in touch.

The contact form requires that you configure reCAPTCHA in the site configuration.

The contact form requires that you select an email template.