Sales Database and Reporting Dashboard

Sales Database and Reporting Dashboard Built in Microsoft Access

The Background

Our client is selling Telecoms products to customers in an area covering 3 counties. They are required to keep track of certain information and metrics for them but also record metrics for their own use. To do this they were using a mixture of spreadsheets provided by the Telecoms company and paper form filling. Some parts of the spreadsheets were irrelevant and they were not particularly user-friendly, hence they were looking for a way to improve their data input; to make it more user-friendly and also so that historic data was kept together and backed up appropriately.

The company were also intending to update and upgrade their IT systems, including updating their windows software to Office 365 and installing screens in their offices to give suitable displays of key metrics.

The key requirements were:

A cloud-based data storage solution that would be easily accessible from different locations and be backed up at regular intervals

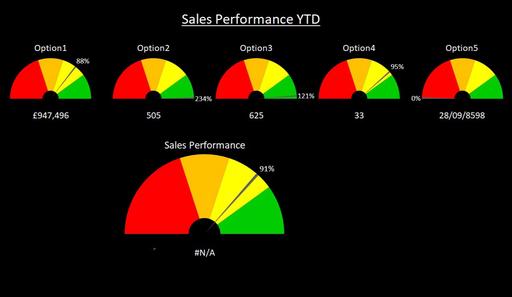
New report designs to give appropriate, at a glance, feedback to their Sales Agents and to be displayed on their new office screens.

The Solution

It was decided to use an Azure SQL Server Database to store the data in the cloud, with an MS Access Front End. Appropriate data would be exported to Excel Templates in order to generate the various reports.

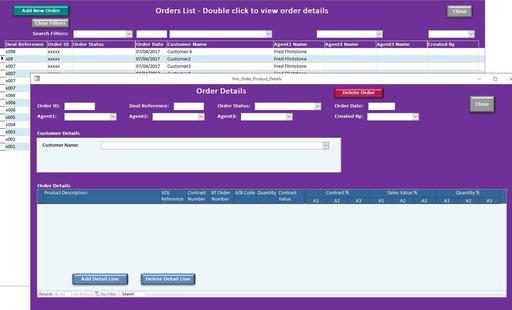
Part 1: Sales and Orders Database

Initially, the database was designed in Access to allow the data structure to be amended before it was migrated to Azure.

There were three separate data sources which needed to be integrated into the database.

Sales Log

This spreadsheet contained details of all orders, making use of several different lookup tables on different tabs of the spreadsheet. It had multiple lines per order with many fields duplicated and a large number of calculated fields which were normally hidden. In addition, each field was completed manually, introducing the possibility of errors within the data. The data was normalised to prevent duplication and IDs were introduced for a number of fields (such as Customers and Agents) so that these could then be selected rather than typed to prevent errors. All sets of lookup data were created as individual tables and the Product and charging information was split into a number of tables to facilitate access to this information. An importer was built to bring this data in from the latest spreadsheet to the appropriate tables.


Additional Order History Output from Telecoms Company

This spreadsheet was generated entirely by the Telecoms company and contained some graphical report summaries on the previous week. The client wanted to automate these reports for screen display as well as creating a number of additional reports using the same data. The simplest approach was to import this data into a single table, separate from the rest of the structure, since it was only used for reporting purposes. Since the data itself was regenerated on a monthly basis, historic data was subject to change and so the importer was designed to replace the contents of the data table with the latest version of the spreadsheet data, every time the import was run.

Staff Metrics Paper Forms

These forms were used to record key metrics for each agent and for them to do their own self-assessment each week. To replace the paper forms, the client decided to change the process altogether, so that data which was gathered from the Sales Agents’ diaries was to be input by administrative staff, using a new form. Only the self-assessment section of the original paper form would be required to be completely by the Sales Agents. Hence a table of metrics was designed to hold numeric data for each agent, for each day (which was not held within the Orders table structure) and another to hold self-assessment notes for each week.

Role Metrics for Staff

Each member of staff had different assessment metrics, depending on their “Role”; the metrics came from two sources, the Staff Metrics data and the Order data; and some metrics were assessed monthly, whilst others were assessed weekly. In addition, there were monthly commission limits dependent on Sales Value (a calculated value based on the value of the contract, the type of product sold and the number of agents involved in the sale. This was broken down into a number of tables linking roles to Staff and also to Weekly Assessed Metrics, Monthly Assessed Metrics and Commission calculations.

Form Design and Functionality

Once the tables structure was correct, forms were designed around it. To input the Order data, individual orders were displayed as a list, with the option to filter the display using agent names, dates and customers. Double-clicking a line opened a second form to display and amend the order details. Permissions were set so that only Management and Admin staff could edit order details. Individual Agents could view only their own orders and were unable to amend any details.


A data entry form was designed for quick and easy entry of “Sales Executive Numbers” data. The original paper form had to be redesigned slightly to allow the metrics used for assessment and their targets to be changed but the appearance was kept as similar to the original paper form as possible.

Additional forms were written to allow lookup information to be viewed and for making changes to Staff members’ details and their assessment metrics.

Once this functionality had been validated by the customer, the data tables were migrated into the Azure database. Some fields and methods for adding data were then amended to ensure the functionality was correct, to avoid errors occurring and to introduce error trapping and handling in the event that an error did occur. To speed up the database a series of views were created to be the data source for a number of forms. Views were also used to format the data to be exported into the Excel report templates, so that calculations could be run within the database and only numeric data would be output to Excel to keep file sizes down.

A variety of permission settings were created to manage which staff members were able to view and amend different sets of data

Part 2: Reporting and Data Displays

A variety of reports were required by the client, some were based on existing Excel files and reports, others were new and used the new data structure within the database. Three separate report templates were created; each containing several reports based on a different data set. For each template, new Views were created in the SQL database to provide the correct data (including all calculated fields) in an appropriate format for the Excel tool to use. A form was written to allow the location of each template to be selected and then the data to be exported into the appropriate template.


Within each excel template, additional calculations and formulae were written to do some additional data format. A variety of graphical displays were created using Excel’s chart functionality. Named data ranges were defined to allow the charts to display different data sets by means of a Selection Box menu. Additional graphical formatting was required to put the graphed data in a format suitable for screen display.

A timer module was written to allow the user to select which graphs they wished to display and for how long, so that the file would cycle through displaying the various different displays.

Contact us for a free consultation

Either call us now on 020 3817 6945 or fill out the form below and one of our team will be in touch.

The contact form requires that you configure reCAPTCHA in the site configuration.

The contact form requires that you select an email template.